Hypothesis tests pt 2
Lecture 14
Duke University
SOCIOL 333 - Summer Term 1 2023
2023-06-12
Logistics
Project component 3, results: draft by Thursday (June 15), submit for grading next Tuesday (June 20)
- Drafts should be complete–meaning you attempted all parts
Today
- Hypothesis tests in more specifics
Hypothesis test process
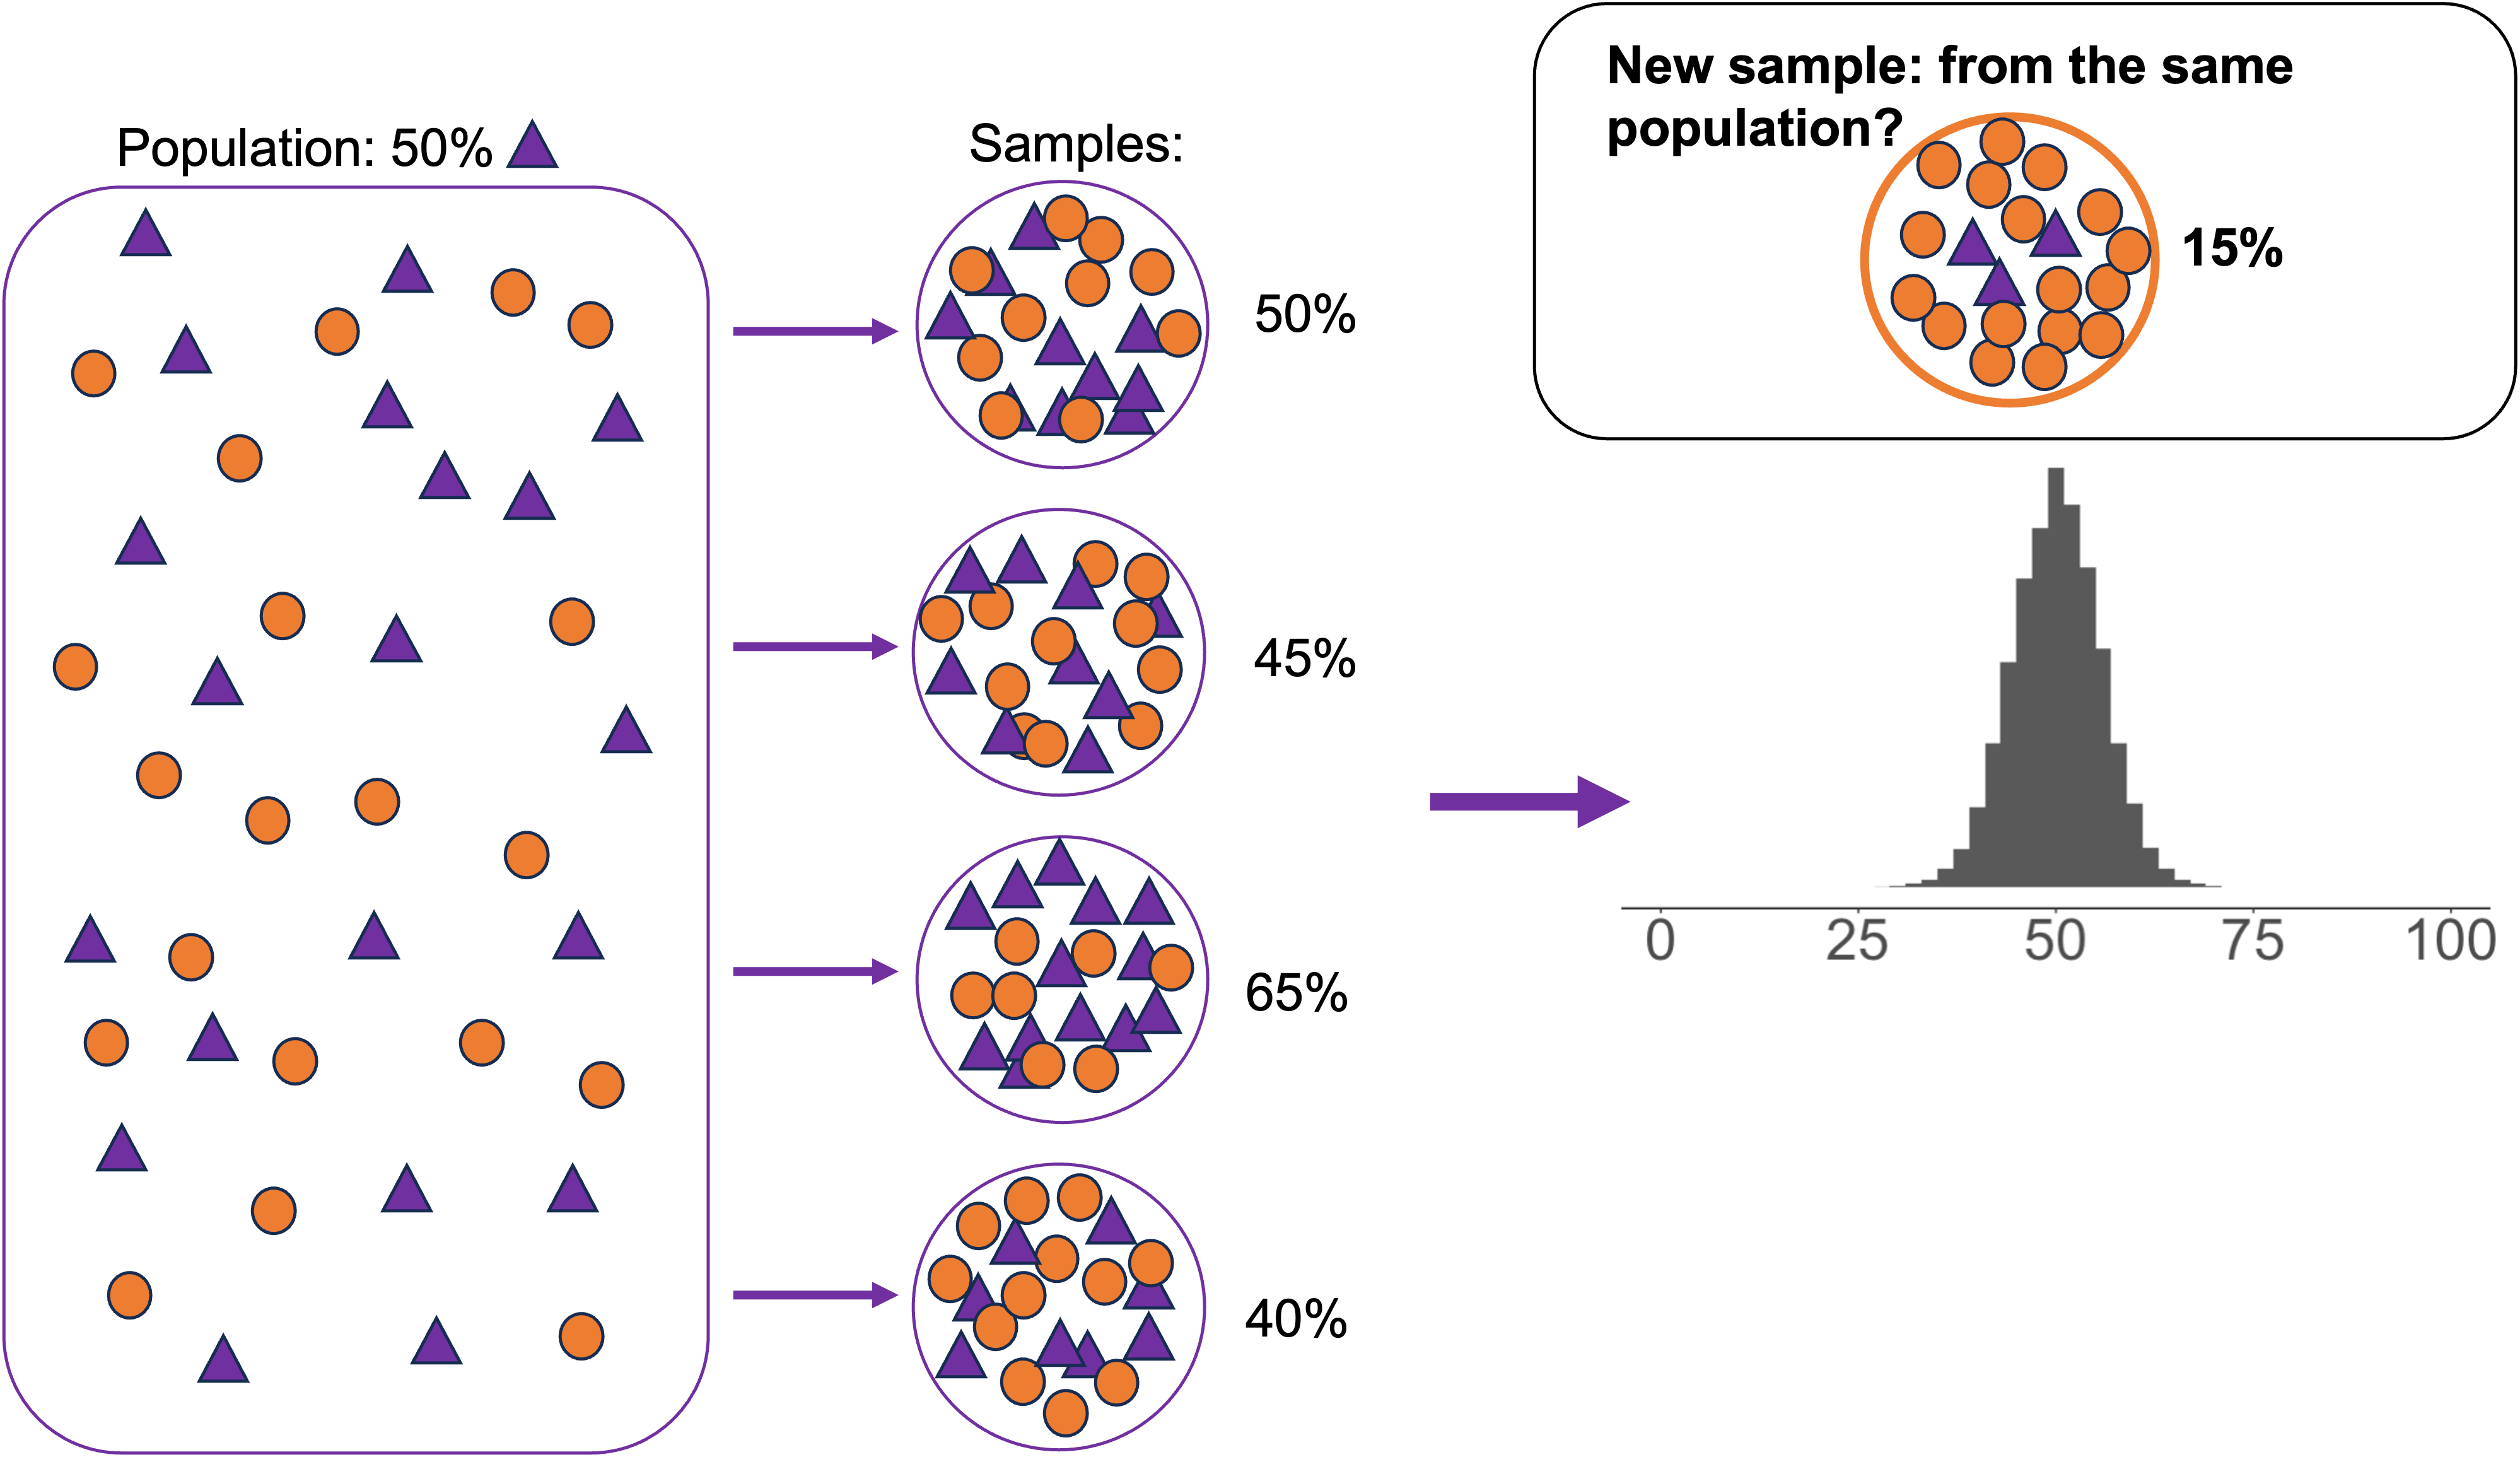
Define your null hypothesis (boring result; nothing is happening; no group differences) and an alternative hypothesis (the other possibility)
In the world where your null hypothesis is true, would your sample be super weird? Run a test to find out!
- Figure out what statistical test you need to run. This depends on the types of your variables.
- Run the test
- Interpret the p value the test gives you. This tells you whether your sample falls far enough outside the expected distribution.
If the sample is sufficiently different than we expected, we reject the null hypothesis in favor of the alternative hypothesis
If not, we fail to reject the null hypothesis
- “Fail” sounds harsh, but this is normal and fine! We do analysis to find out if our predictions are true–sometimes they aren’t and that’s valuable information.
Conditions for hypothesis tests
- Sampling distributions follow predictable shapes (and so hypothesis tests “work”) when two conditions are met:
Independence: The value of one observation in the sample does not depend on the values of any of the others.
- Random sampling of individuals guarantees independence
- So does random assignment to experimental conditions
- Example that is not independent: I am interested in relationship satisfaction in monogamous relationships. I sample couples and ask both partners in each couple how satisfied they are.
- One partner’s satisfaction is surely related to the other’s!
Samples are large enough: Big samples are more likely to generate normal sampling distributions.
- How large is large enough depends on the specific test
How do I know if my sample is weird?
General hypothesis test logic
- Would the sample fall within the distribution of the samples you would get under the null hypothesis (the null distribution)?

Understanding distributions: with the normal distribution as an example
Distributions
Null distributions take different shapes depending on what test statistic you calculate
- Which in turn depends on the combination of categorical and numeric variables you have—different tests (and so test statistics) are appropriate for different kinds of variables
But one very common one is the normal distribution
- Bell-shaped; defined by a mean and a standard deviation
Z scores
Z scores are a measure of how far an observation is from the center of a normal distribution, in units of standard deviation (or standard error–more on the difference in a moment).
Z scores are the test statistic for the normal distribution
Why are standard units important? For comparing across distributions.
- A Z score of -1 means the same thing in every normal distribution: the observation is one standard deviation below the mean.

Standard deviation vs standard error
- Normal distributions can describe either individual samples or the distribution of sample statistics between samples—we’ll do both here.
- The logic is exactly the same, but the name for the measure of distribution spread varies slightly.
- Standard deviation: measures variation within a single sample
- Standard error: measures variation in a sample statistic between multiple samples.
Standard deviation vs standard error
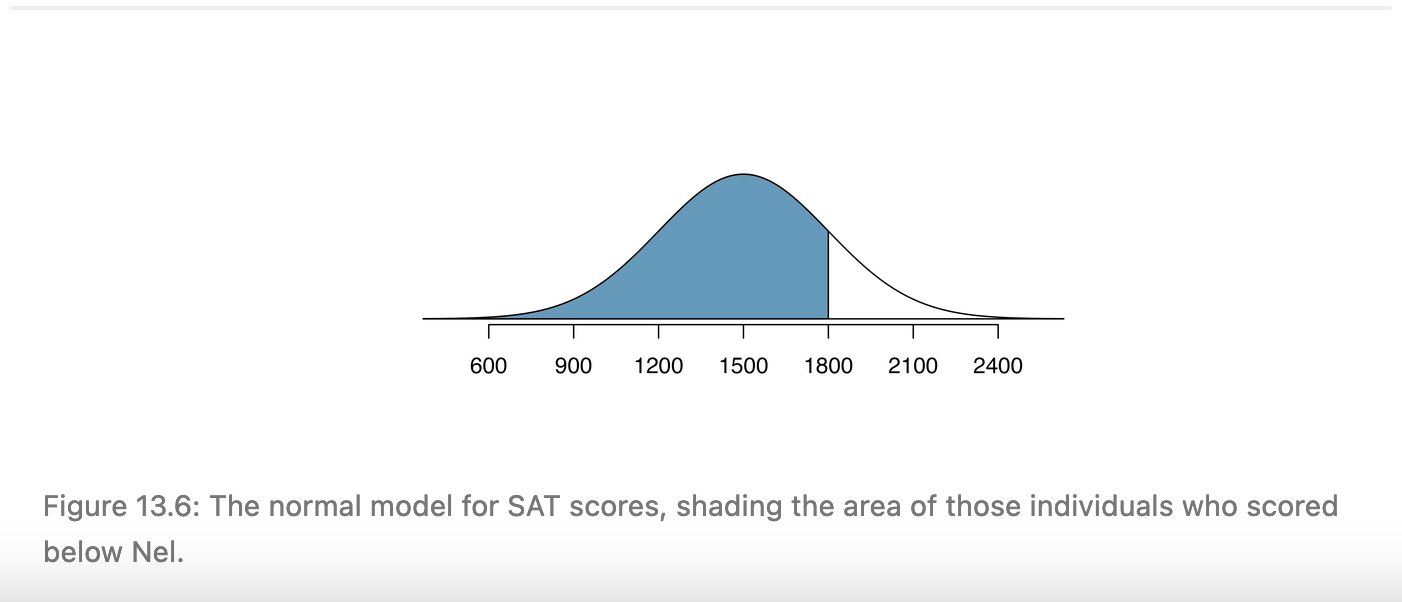
Example: Scores on the (pre-2016) SAT were normally distributed with a mean of 1500 points and a standard deviation of 300 points.
- That distribution describes the scores of individual students who take the SAT
- So standard deviation is the term we use to describe its spread
Standard deviation vs standard error
Now imagine that we randomly sampled students and asked them to provide their SAT scores. We have many samples of 25 students each.
The mean score in each 25-student sample is our sample statistic
The term for the spread of this sampling distribution is the standard error.
It is determined by formulas that vary depending on the specific situation. You generally won’t calculate it yourself; it will be provided in R output.
Standard error is always smaller than standard deviation: there is more variation within samples from the same population than between them.

Percentiles
Percentile: What percent of the data is below a particular observation.
From 0% to 100%, but generally reported as a proportion instead (0-1).
Something that can be calculated with software (like R)
- The
pnorm()function takes a Z score and gives you the corresponding percentile
- The

Percentiles
[1] 0.8413447- Conclusion: 84% of SAT-takers score below Nel.
Z scores and percentiles
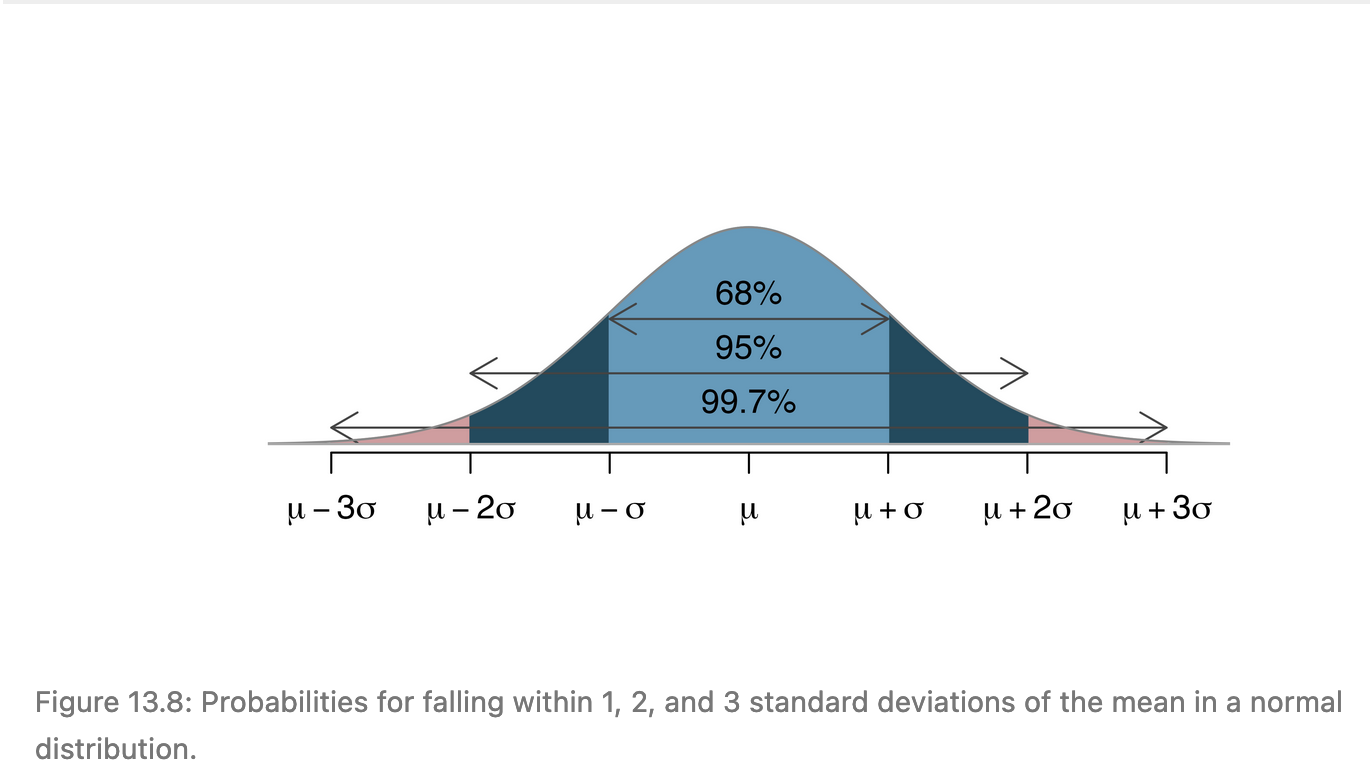
- 68% of observations are within 1 standard error/standard deviation of the mean
- 95% are within 2 standard errors/standard deviations
- 99.7% are within 3 standard errors/standard deviations

Z scores, percentiles, and p values: example
- Heights of US adults who identify as men follow a normal distribution. Mean = 70 inches; standard deviation = 3.3 inches.

Z scores: exercise Q1
What is the Z score of a man who is 70 inches tall?
- Zero!
- 70 is the mean of this distribution. An observation whose value is exactly equal to the mean has a Z score of 0.

Z scores: exercise Q2
What is the Z score of a man who is 65 inches tall?
- About 1.3
- About -3
- About -1.5

Z scores: exercise Q2
- About -1.5

Percentiles: exercise Q3
If someone is in the 30th percentile in terms of height, is their height most likely:
- About 68 inches
- About 72 inches
- About 62 inches

Percentiles: exercise Q3
- About 68 inches

P values
Percentiles/Z scores quantify how far our sample is from what we expected under the null hypothesis
P value: closely related to percentile. How much of the expected distribution under the null hypothesis has a value more extreme than what we find in our sample?
- In other words: If the null hypothesis were true, what would the probability be of getting a sample as or more extreme than what was actually observed?
One-tailed vs two-tailed tests
How we think about p values depends on if our hypothesis test is one-tailed or two-tailed.
One-tailed: we reject the null hypothesis only if our alternative hypothesis is specific about the direction of difference.
- New Yorkers sleep less than people in other cities.
- The average number of friends for people who live in rural areas of the US has increased over the past 50 years
Two-tailed: we reject the null hypothesis if direction is not important: ie, if the sample statistic is either significantly bigger or significantly smaller than we expect.
- New Yorkers sleep a different amount than people in other cities
- The average number of friends for people who live in rural areas of the US has changed over the past 50 years.
Most hypothesis tests involving normal distributions in sociology are two-tailed, and most software defaults to two-tailed tests.
When using some other distributions, like Chi square distributions, tests are always one-tailed—more on that another day.
One-tailed p values
The p value for a one-tailed test is the percent of the distribution that is either bigger or smaller than the observed value (depending on which direction the hypothesis takes).
Example: If you randomly select an American who identifies as a man, what is the probability his height will be 63.4 inches or less? (recall the height distribution: mean 70 inches, standard deviation 3.3 inches)

One-tailed p values
- In this case, p value and percentile are the same!
One-tailed p values
What is the probability of randomly selecting an American man who is 76.6 inches tall or taller? (use the same height distribution)
First: Draw the distribution and shade the area we are interested in.

One tailed p values

- What is the p value here?
- Is it the same as the percentile?
Two-tailed p values
- The p value for a two-tailed test is the probability that you would have drawn a sample equal to or more extreme than the one you have, in either direction.
- We count something as “more extreme” if it is larger in absolute Z score.
Two-tailed p values
Example: What is the probability of randomly selecting an American man whose height is two or more standard deviations from the mean?
- In other words: the probability of randomly selecting a man who is either 63.4 inches or shorter OR 76.6 inches or taller

P values and statistical significance
Back to our question from earlier: how do I know if my sample is weird enough to warrant rejecting my null hypothesis?
We define threshold p values before we run tests
If the p value we get is smaller than the threshold, we say the sample provides statistically significant evidence against the null hypothesis, and we reject it.
Most common cutoff, by (arbitrary but common) convention: p = 0.05
- So, if we get a p value for our sample smaller than 0.05–meaning that there was a less than five percent chance that we would have obtained our result if the null was true–we reject the null.
Hypothesis tests for different variable types
Hypothesis test process
Define your null hypothesis (boring result; nothing is happening; no group differences) and an alternative hypothesis (the other possibility)
In the world where your null hypothesis is true, would your sample be super weird? Run a test to find out!
- Figure out what statistical test you need to run. This depends on the types of your variables.
- Run the test
- Interpret the p value the test gives you. This tells you whether your sample falls far enough outside the expected distribution.
If the sample is sufficiently different than we expected, we reject the null hypothesis in favor of the alternative hypothesis
If not, we fail to reject the null hypothesis
Different types of tests
Now that we know a little bit about distributions, how do we run tests on data?
Step 1: Figure out what kind of test you need
This depends on your variable types. Are they…
- Categorical with two categories (including binary variables)?
- Categorical with three or more categories?
- Numeric?
- Wait, what about ordinal? Ordinal variables are tricky. For our purposes, you can choose to treat them as either numeric or nominal categorical variables instead.
It also depends on how many variables your question involves
- Two? (one explanatory variable; one response variable)
- Or more than two? (more than one explanatory variable; one response variable)
Does this feel similar to plotting? Lots of things depend on what kind of variables you have!
Different types of tests: An overview
- Which test to use is not as cut-and-dry as you might hope—there is overlap in use cases. This is my recommendation for this class.
- These terms won’t mean much to you right now. We’ll come back to the specifics.

Identifying the right test: exercise Q4
For each of these research questions, identify the explanatory variable, the response variable, their types, and the correct statistical test. Think about what the data would look like for each individual in these cases
- How does whether a student attended a public or private school affect their chances of graduating high school?
- How do outcomes of traffic stops (warnings, citations, or arrests) vary by the race of the driver?
- How does the probability a doctor refers a patient to a specialist vary by the patient’s body mass index?
- How is a country’s average life expectancy related to the amount of money per person it spends on health care?

Running a hypothesis test in R with infer
The bad news: there are a lot of different tests.
The good news: regardless of what specific test you run, the logic is similar, and your code will look about the same!
We will be using the
inferpackage to conduct hypothesis testsinferis built to work on similar logic to the tidyverse—wherefilter(),mutate(), andggplot()are from- Its documentation is excellent—check out the website (link here) if you ever get stuck
