[1] 2.949948Hypothesis tests pt 1
Lecture 13
Duke University
SOCIOL 333 - Summer Term 1 2023
2023-06-08
Logistics
Project component 2, descriptive statistics, due tonight 11:59pm
- Remember that you have 3 late days available–I’d rather it be late but done than on time but incomplete
- Then have a great weekend :)
Today
- Intro to hypothesis testing
- Questions on your projects
The (approximate) data analysis process
- Determine topic ✓
- Find data; learn what observations and variables are available ✓
- Write research question ✓
- Describe distributions of relevant variables ✓
- Prepare data frame for analysis ✓
- Describe relationships between variables ✓
- Perform statistical tests/write models
- Communicate results

Description vs inference
Description: What is the difference between the number of coaches assigned to men’s teams and the number of coaches assigned to women’s teams in my sample?
- What we have done so far: distributions and summary statistics of single variables, investigating relationships between variables
Inference: What is the difference between the number of coaches assigned to men’s teams and the number of coaches assigned to women’s teams in my target population?
- Often: Is there a difference between the number of coaches assigned to men’s teams and the number of coaches assigned to women’s teams in my target population?
- What can we say about our target population using what we know about our sample?
- When do differences and relationships we observe in samples mean there are differences/relationships in the entire target population?
Terminology
- Population parameter: Statistical measure that describes the whole population. What we are interested in finding out.
- Sample statistic (or point estimate): The value of a measure in our sample. What we use to find something out about the population.
Inference
- Example: How much strength training does the average American high school student do?
- Sample:
yrbss(13583 high school students). We will assume this was drawn randomly.
- Our best guess (sample statistic): the center of our sample distribution (we’ll use the mean):
- Do you think this guess is correct?
Inference
If we were able to measure the population parameter–weekly strength training days for our entire target population (all US high school students)–would you expect it to be:
- exactly the same as the sample statistic
- close but not exactly the same as the sample statistic
- pretty different from the sample statistic
- b! Assuming the sample is representative, the two should be close, but they probably won’t be exactly the same.
Inference
- We have statistical tools to tell us more precisely what we can expect our population to be like based on what we observe in our sample.
- We can quantify the uncertainty we have about the characteristics of our population given what we know about the sample we’re using.
Hypothesis testing: the logic
Let’s say I think that 50% of Duke students prefer classes with final exams over classes with final papers.
To check this, I poll a random sample of 100 students. I find that 56 of them prefer final papers over final exams. Does that disprove my hypothesis?
- Probably not! I won’t get a sample that exactly reflects the population every time, even if the sampling is random.
What about if I find that 90 of them prefer final papers over exams?
- This is SUCH a large difference that I should probably be suspicious of my hypothesis. We expect some difference between our sample and our population, but not tons.
Hypothesis testing: overview
Start with a null hypothesis: the boring result; what you’d find if nothing is happening or if everything is the same between groups
- 50% of Duke students prefer final papers over final exams
- There is no difference between the number of coaches assigned to women’s and men’s teams
And a competing alternative hypothesis: the other possibility
- The true proportion of Duke students who prefer final papers over final exams is not 50%
- There is a difference between the number of coaches assigned to women’s and men’s teams
Test whether the data in your sample provides strong enough evidence to overturn or reject the null hypothesis in favor of the alternative hypothesis.
- This usually involves calculating and interpreting a p value
Hypotheses: exercise q1
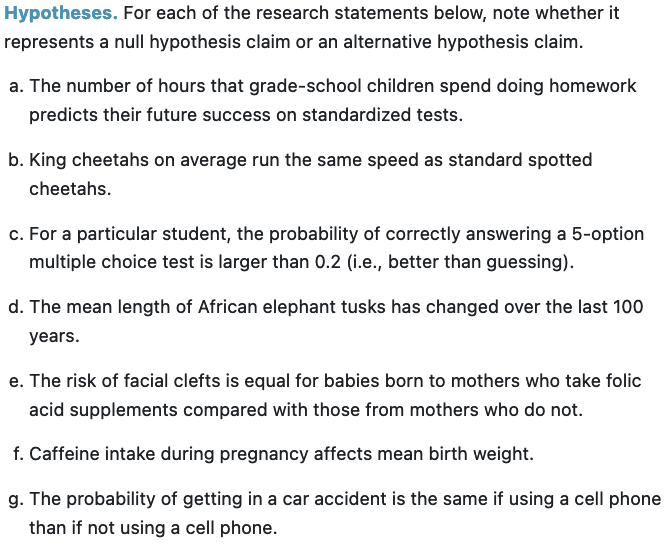
Hypotheses: exercise q2
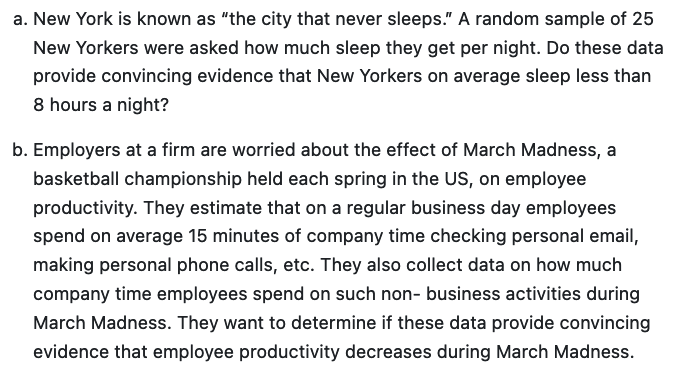
- Write the null and alternative hypotheses for the following studies:
Hypotheses: exercise q2
New York is known as “the city that never sleeps.” A random sample of 25 New Yorkers were asked how much sleep they get per night. Do these data provide convincing evidence that New Yorkers on average sleep less than 8 hours a night?
- Null: New Yorkers sleep 8 hours per night.
- Alternative: New Yorkers sleep less than 8 hours per night.
Hypotheses: exercise q2
Employers at a firm are worried about the effect of March Madness, a basketball championship held each spring in the US, on employee productivity. They estimate that on a regular business day employees spend on average 15 minutes of company time checking personal email, making personal phone calls, etc. They also collect data on how much company time employees spend on such non- business activities during March Madness. They want to determine if these data provide convincing evidence that employee productivity decreases during March Madness.
- Null: Employees spend 15 minutes per day of company time on non-business activities during March Madness.
- Alternative: Employees spend more than 15 minutes per day of company time on non-business activities during March Madness
Testing hypotheses
- How do we tell if our sample statistic is far enough from our null hypothesis to reject it?
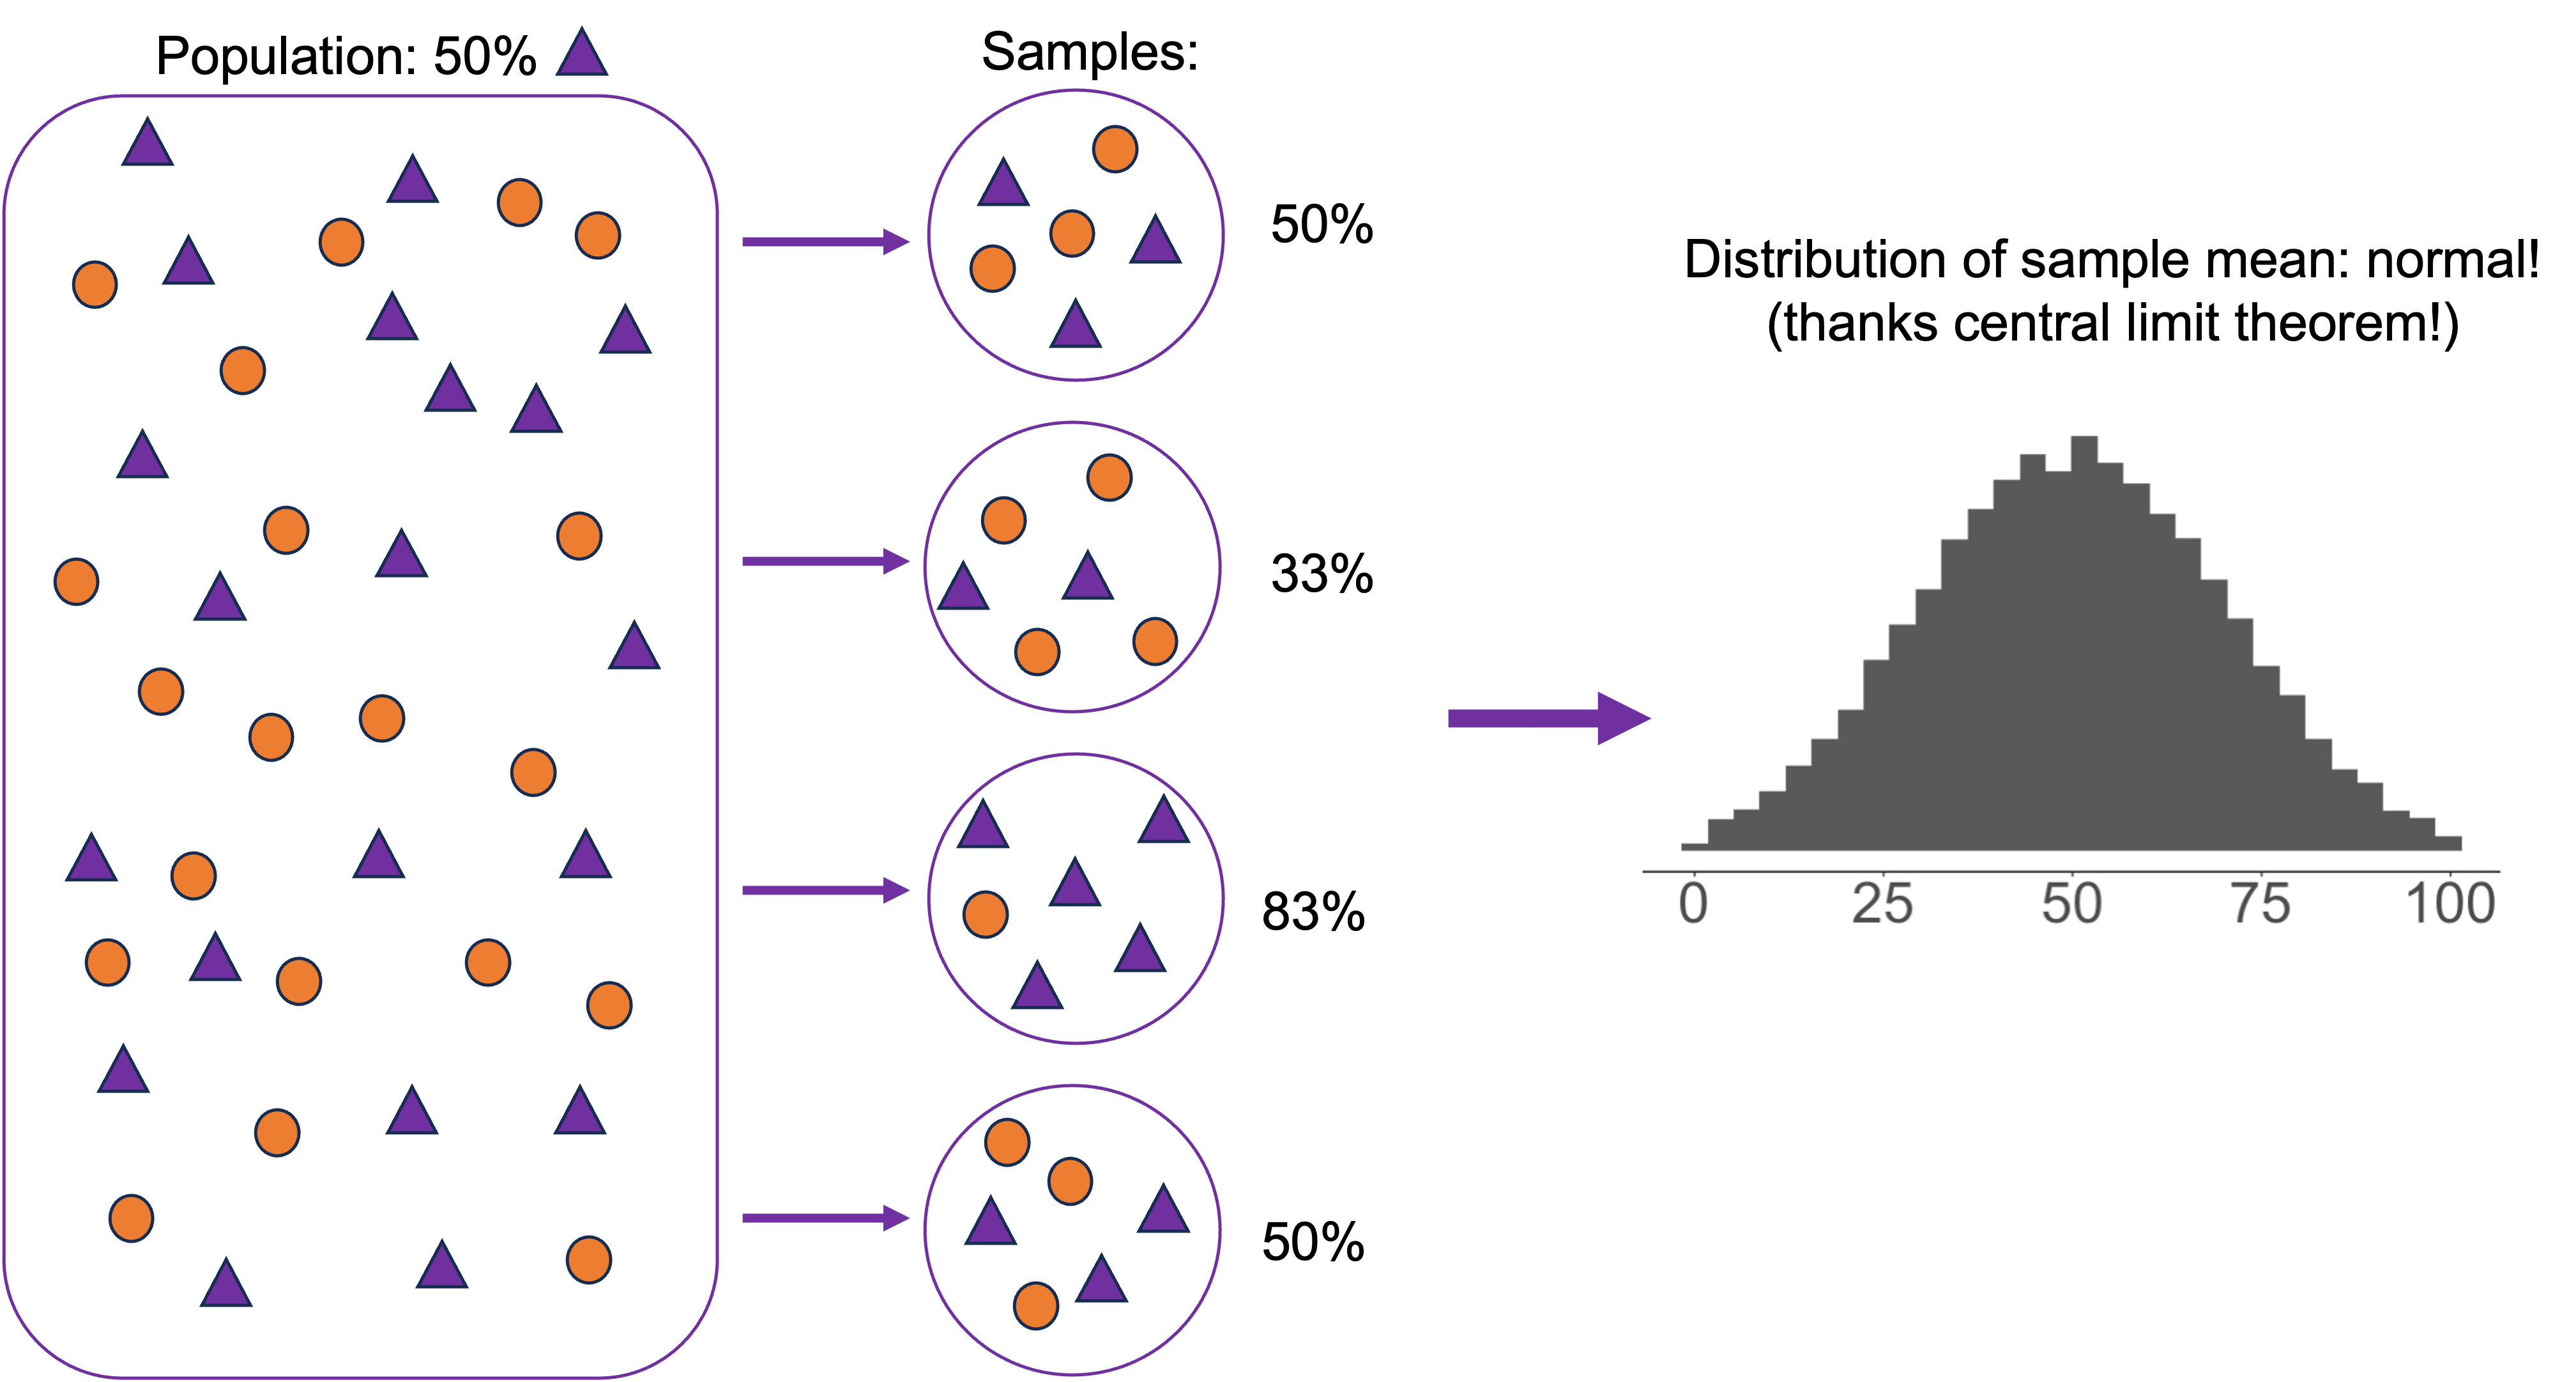
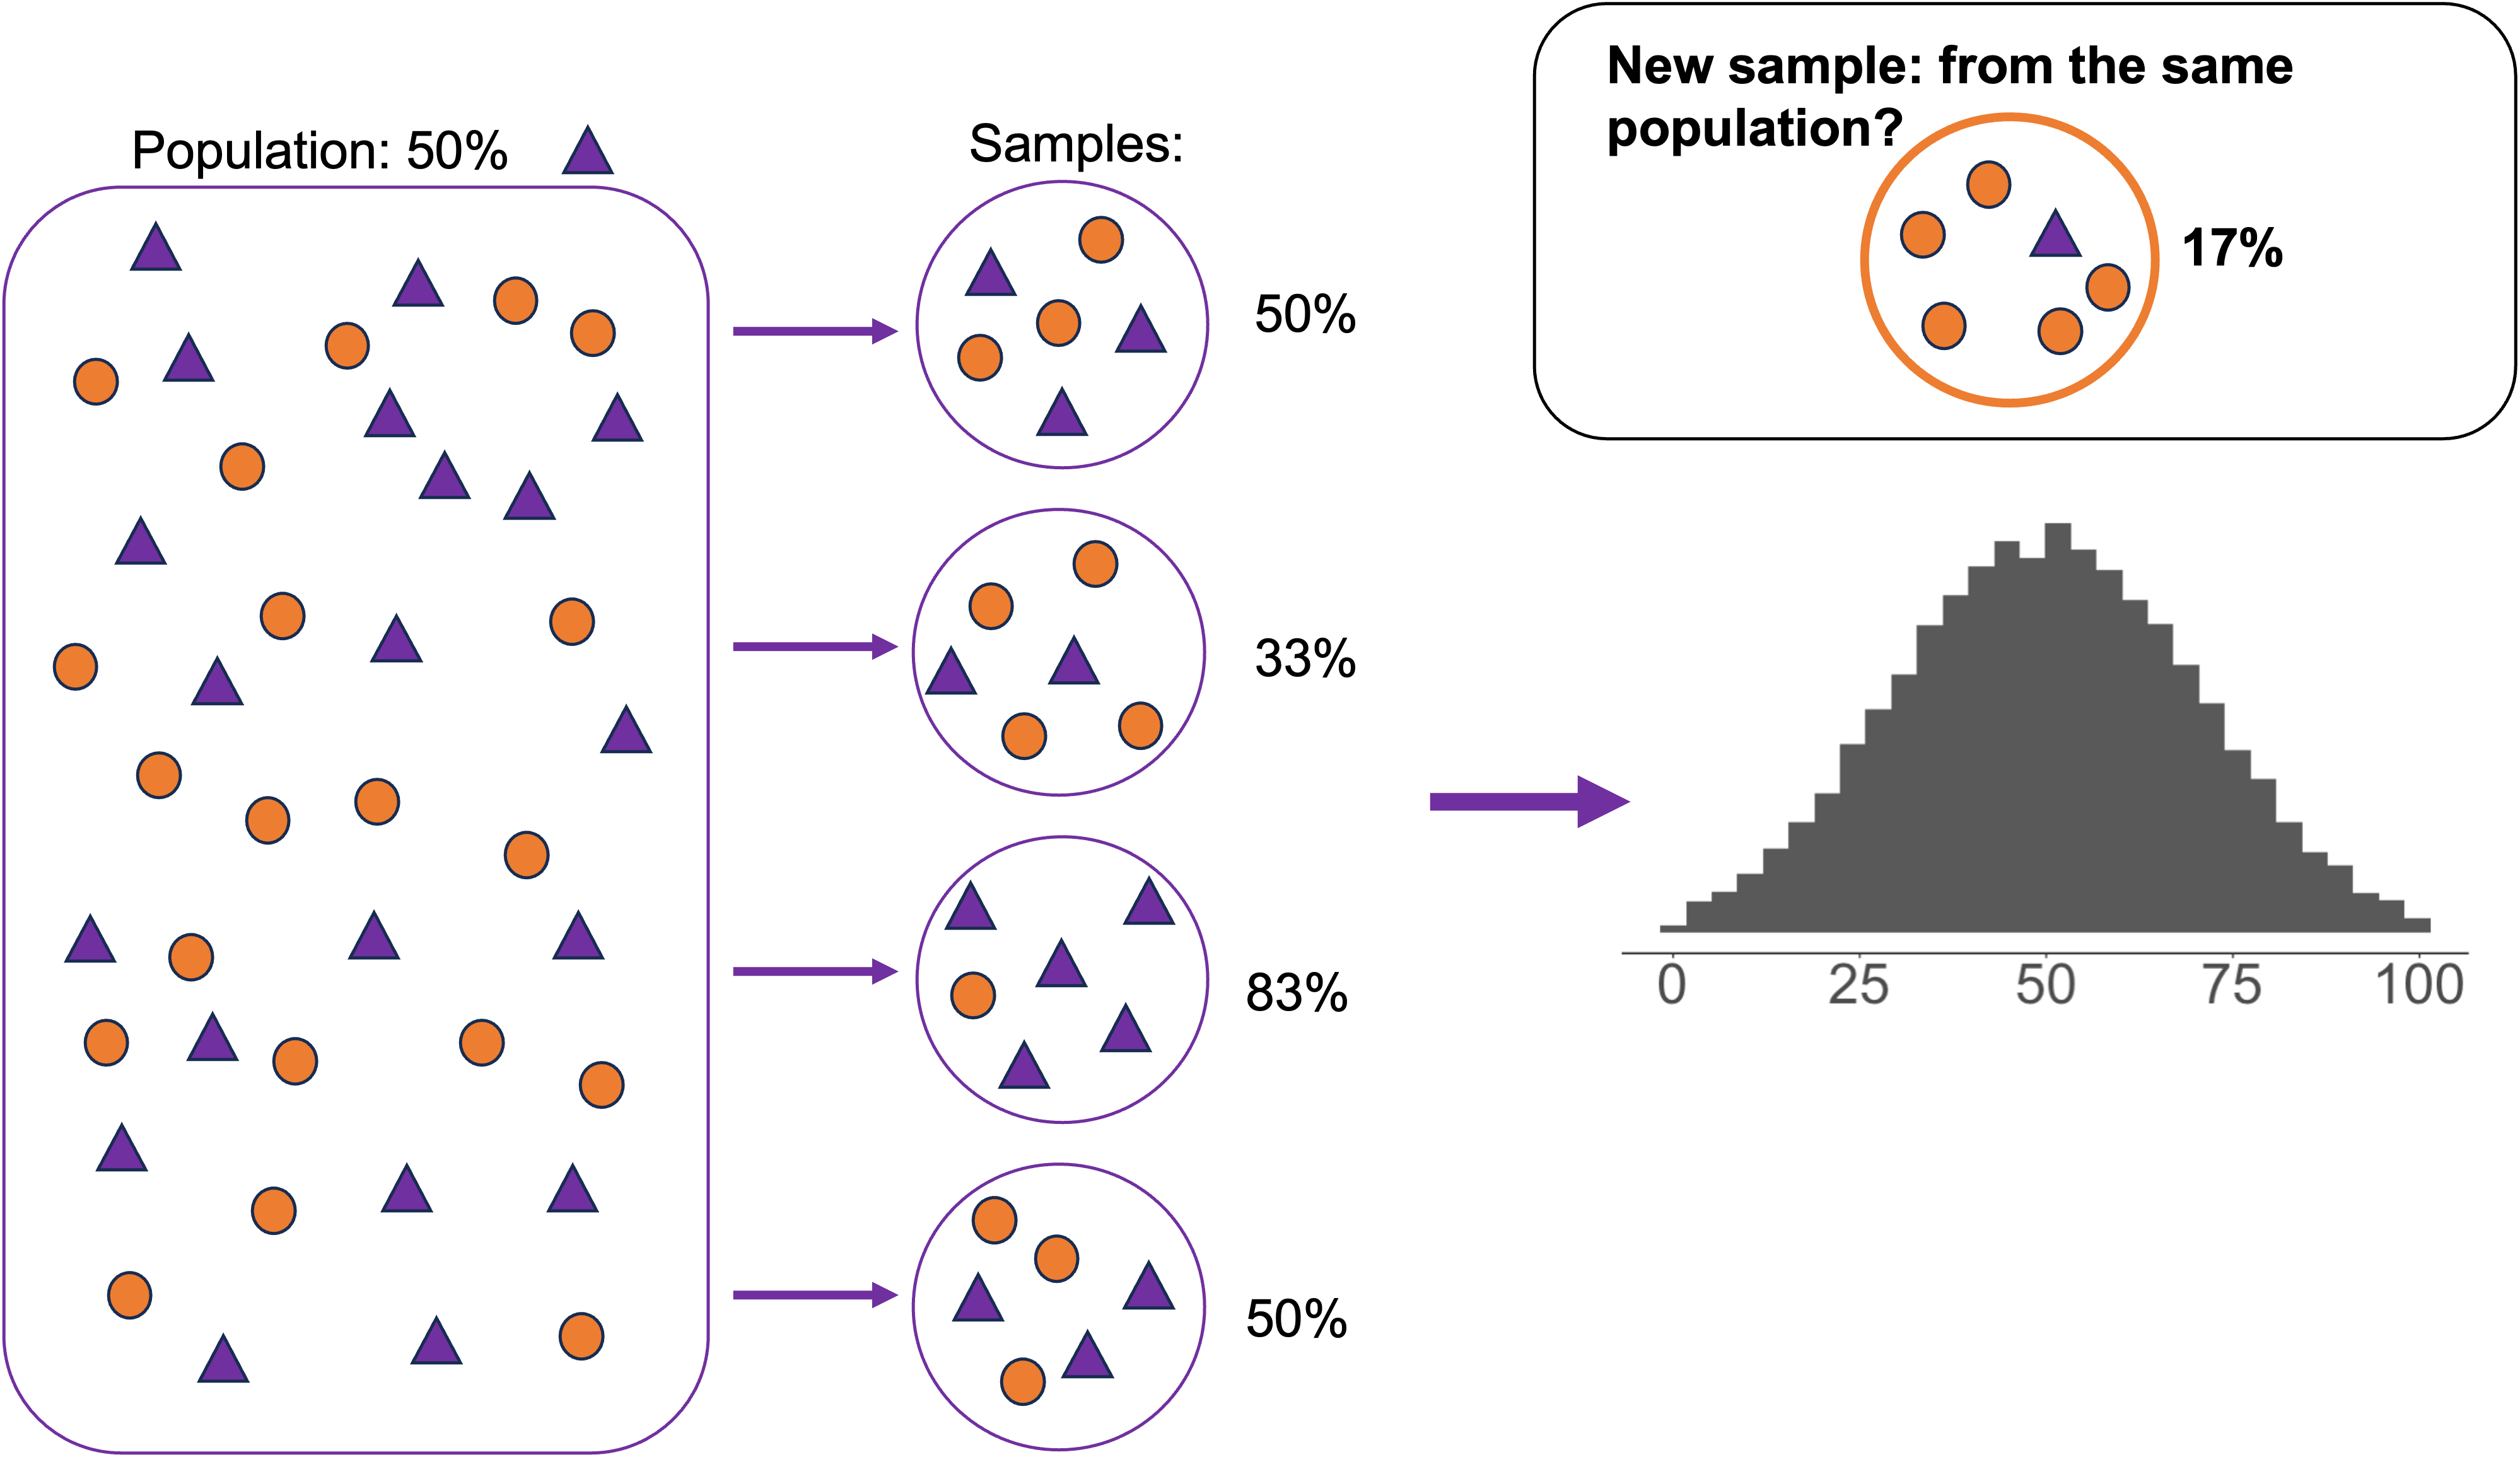
- Imagine that the null hypothesis is true–what kind of samples would we be likely to draw? Given that knowledge, is the sample that we have likely?
Population parameters and sample statistics
Population parameters and sample statistics
Population parameters and sample statistics: bigger sample size
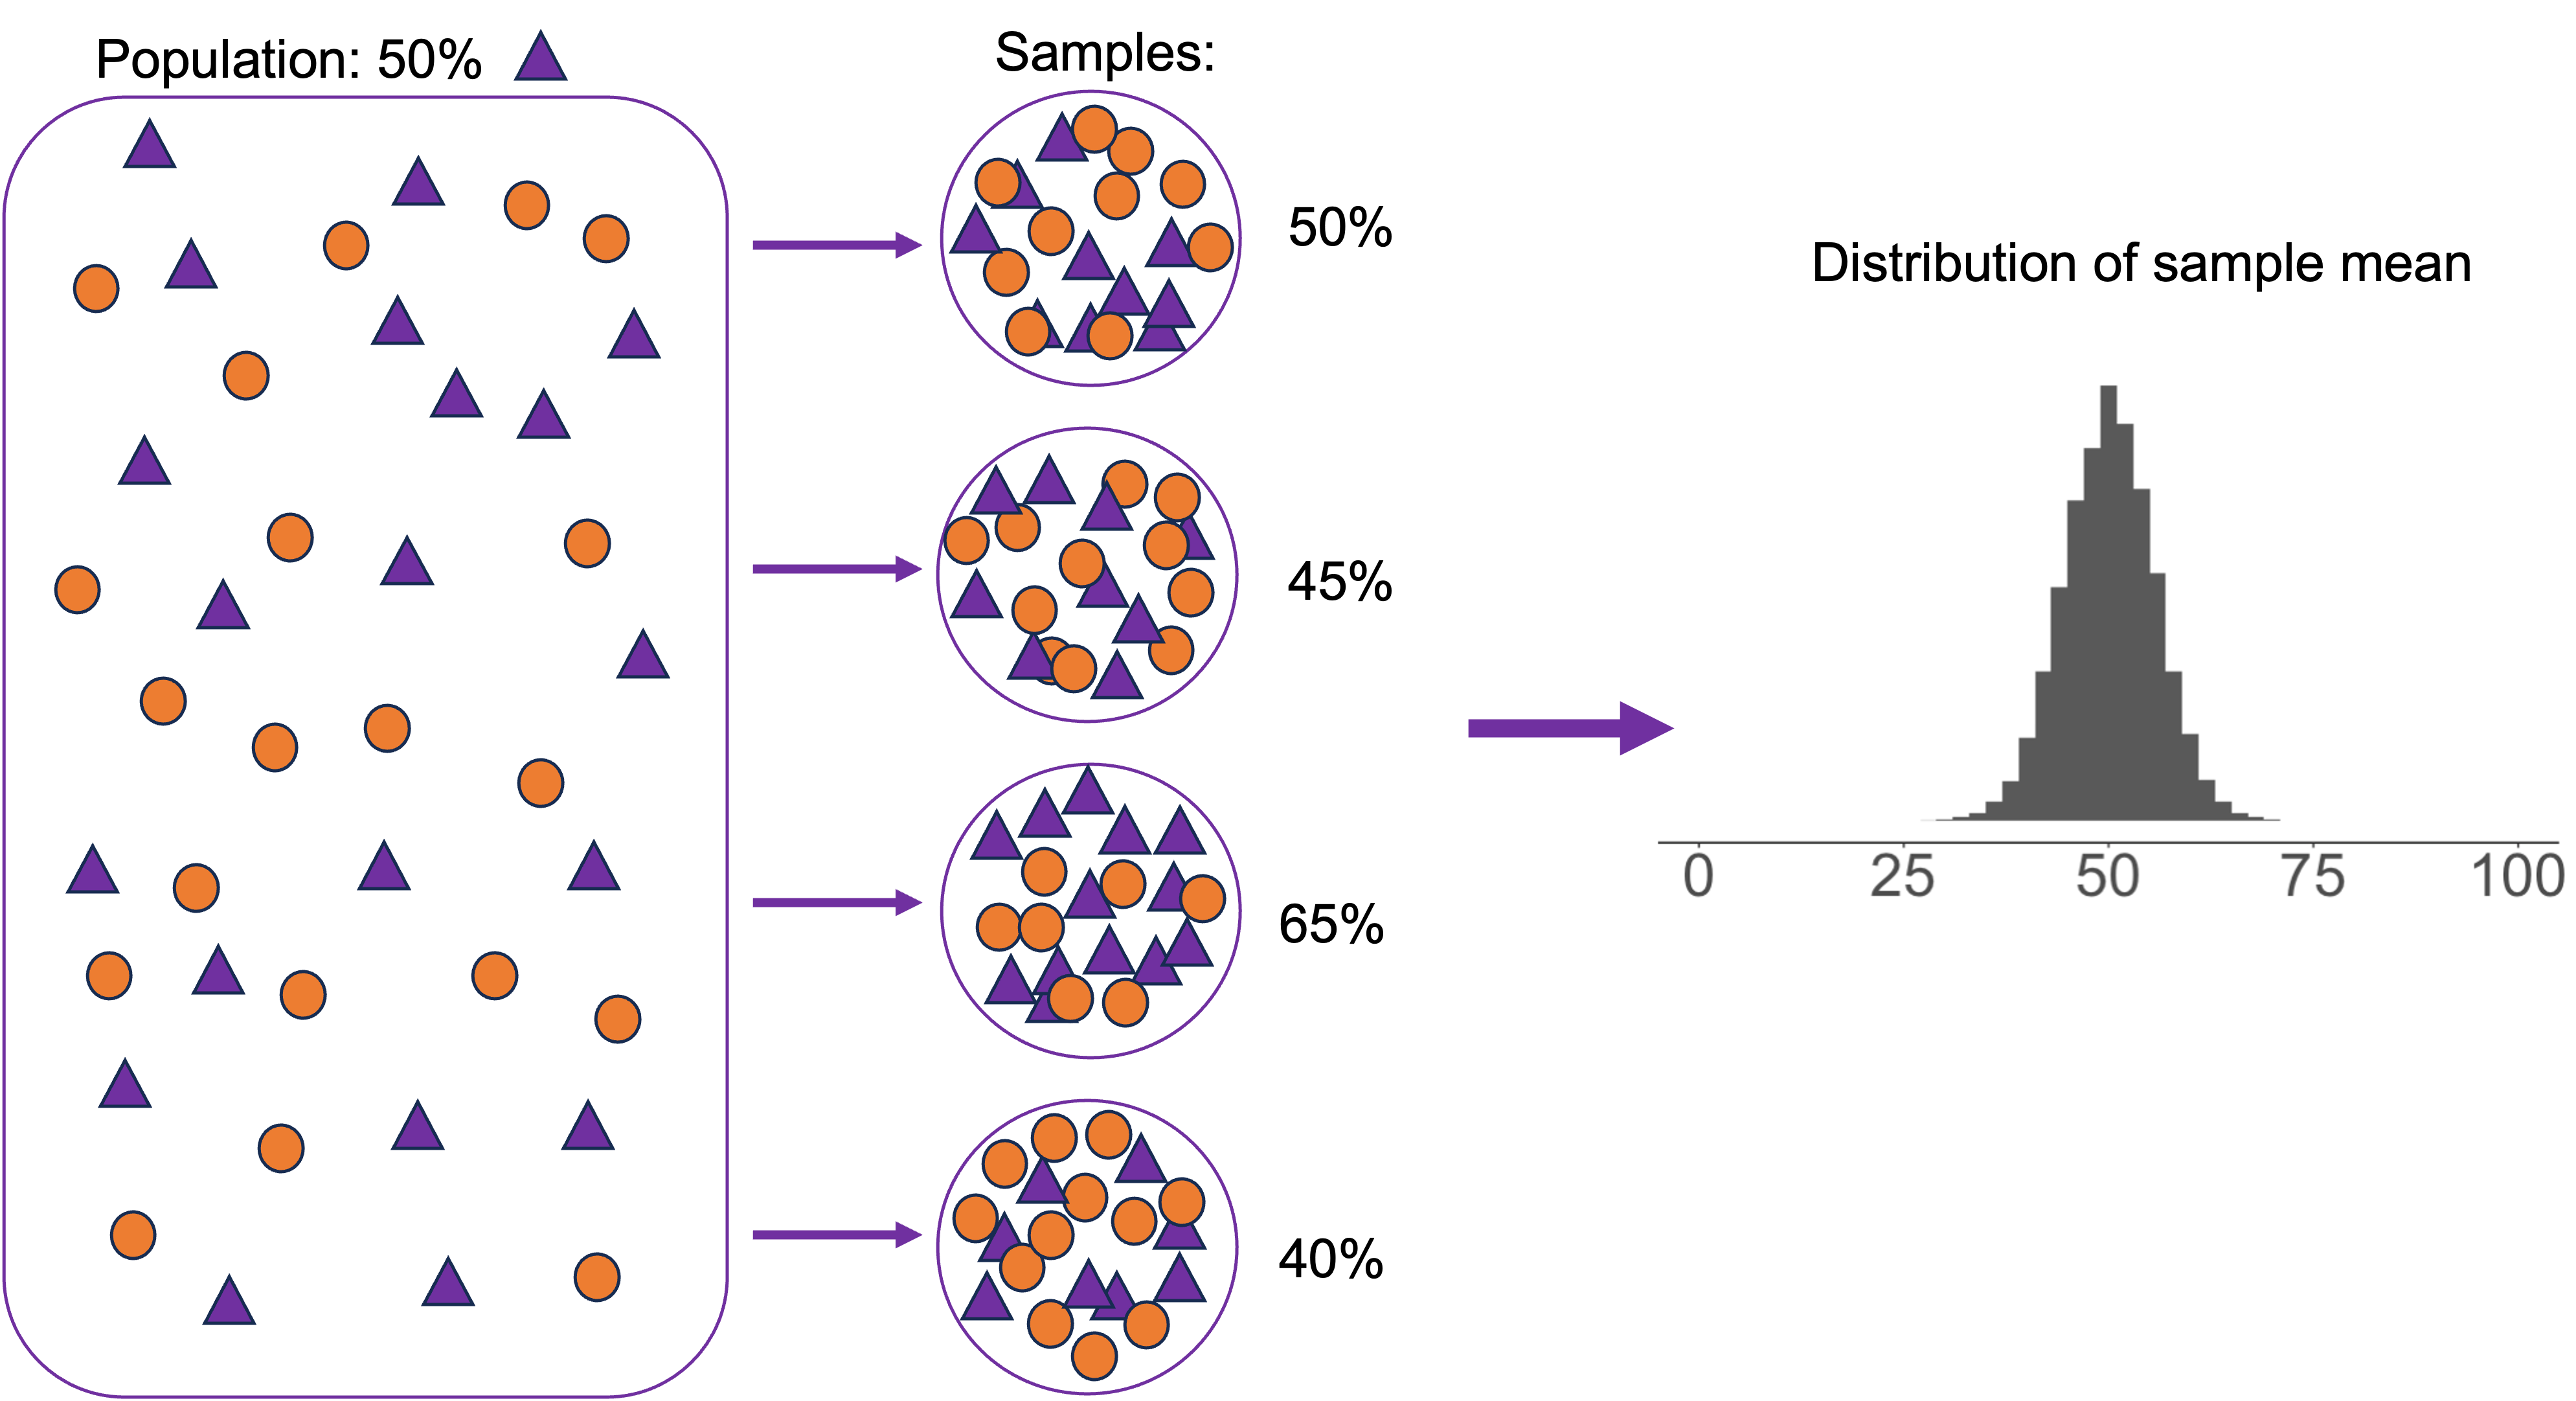
Population parameters and sample statistics: bigger sample size
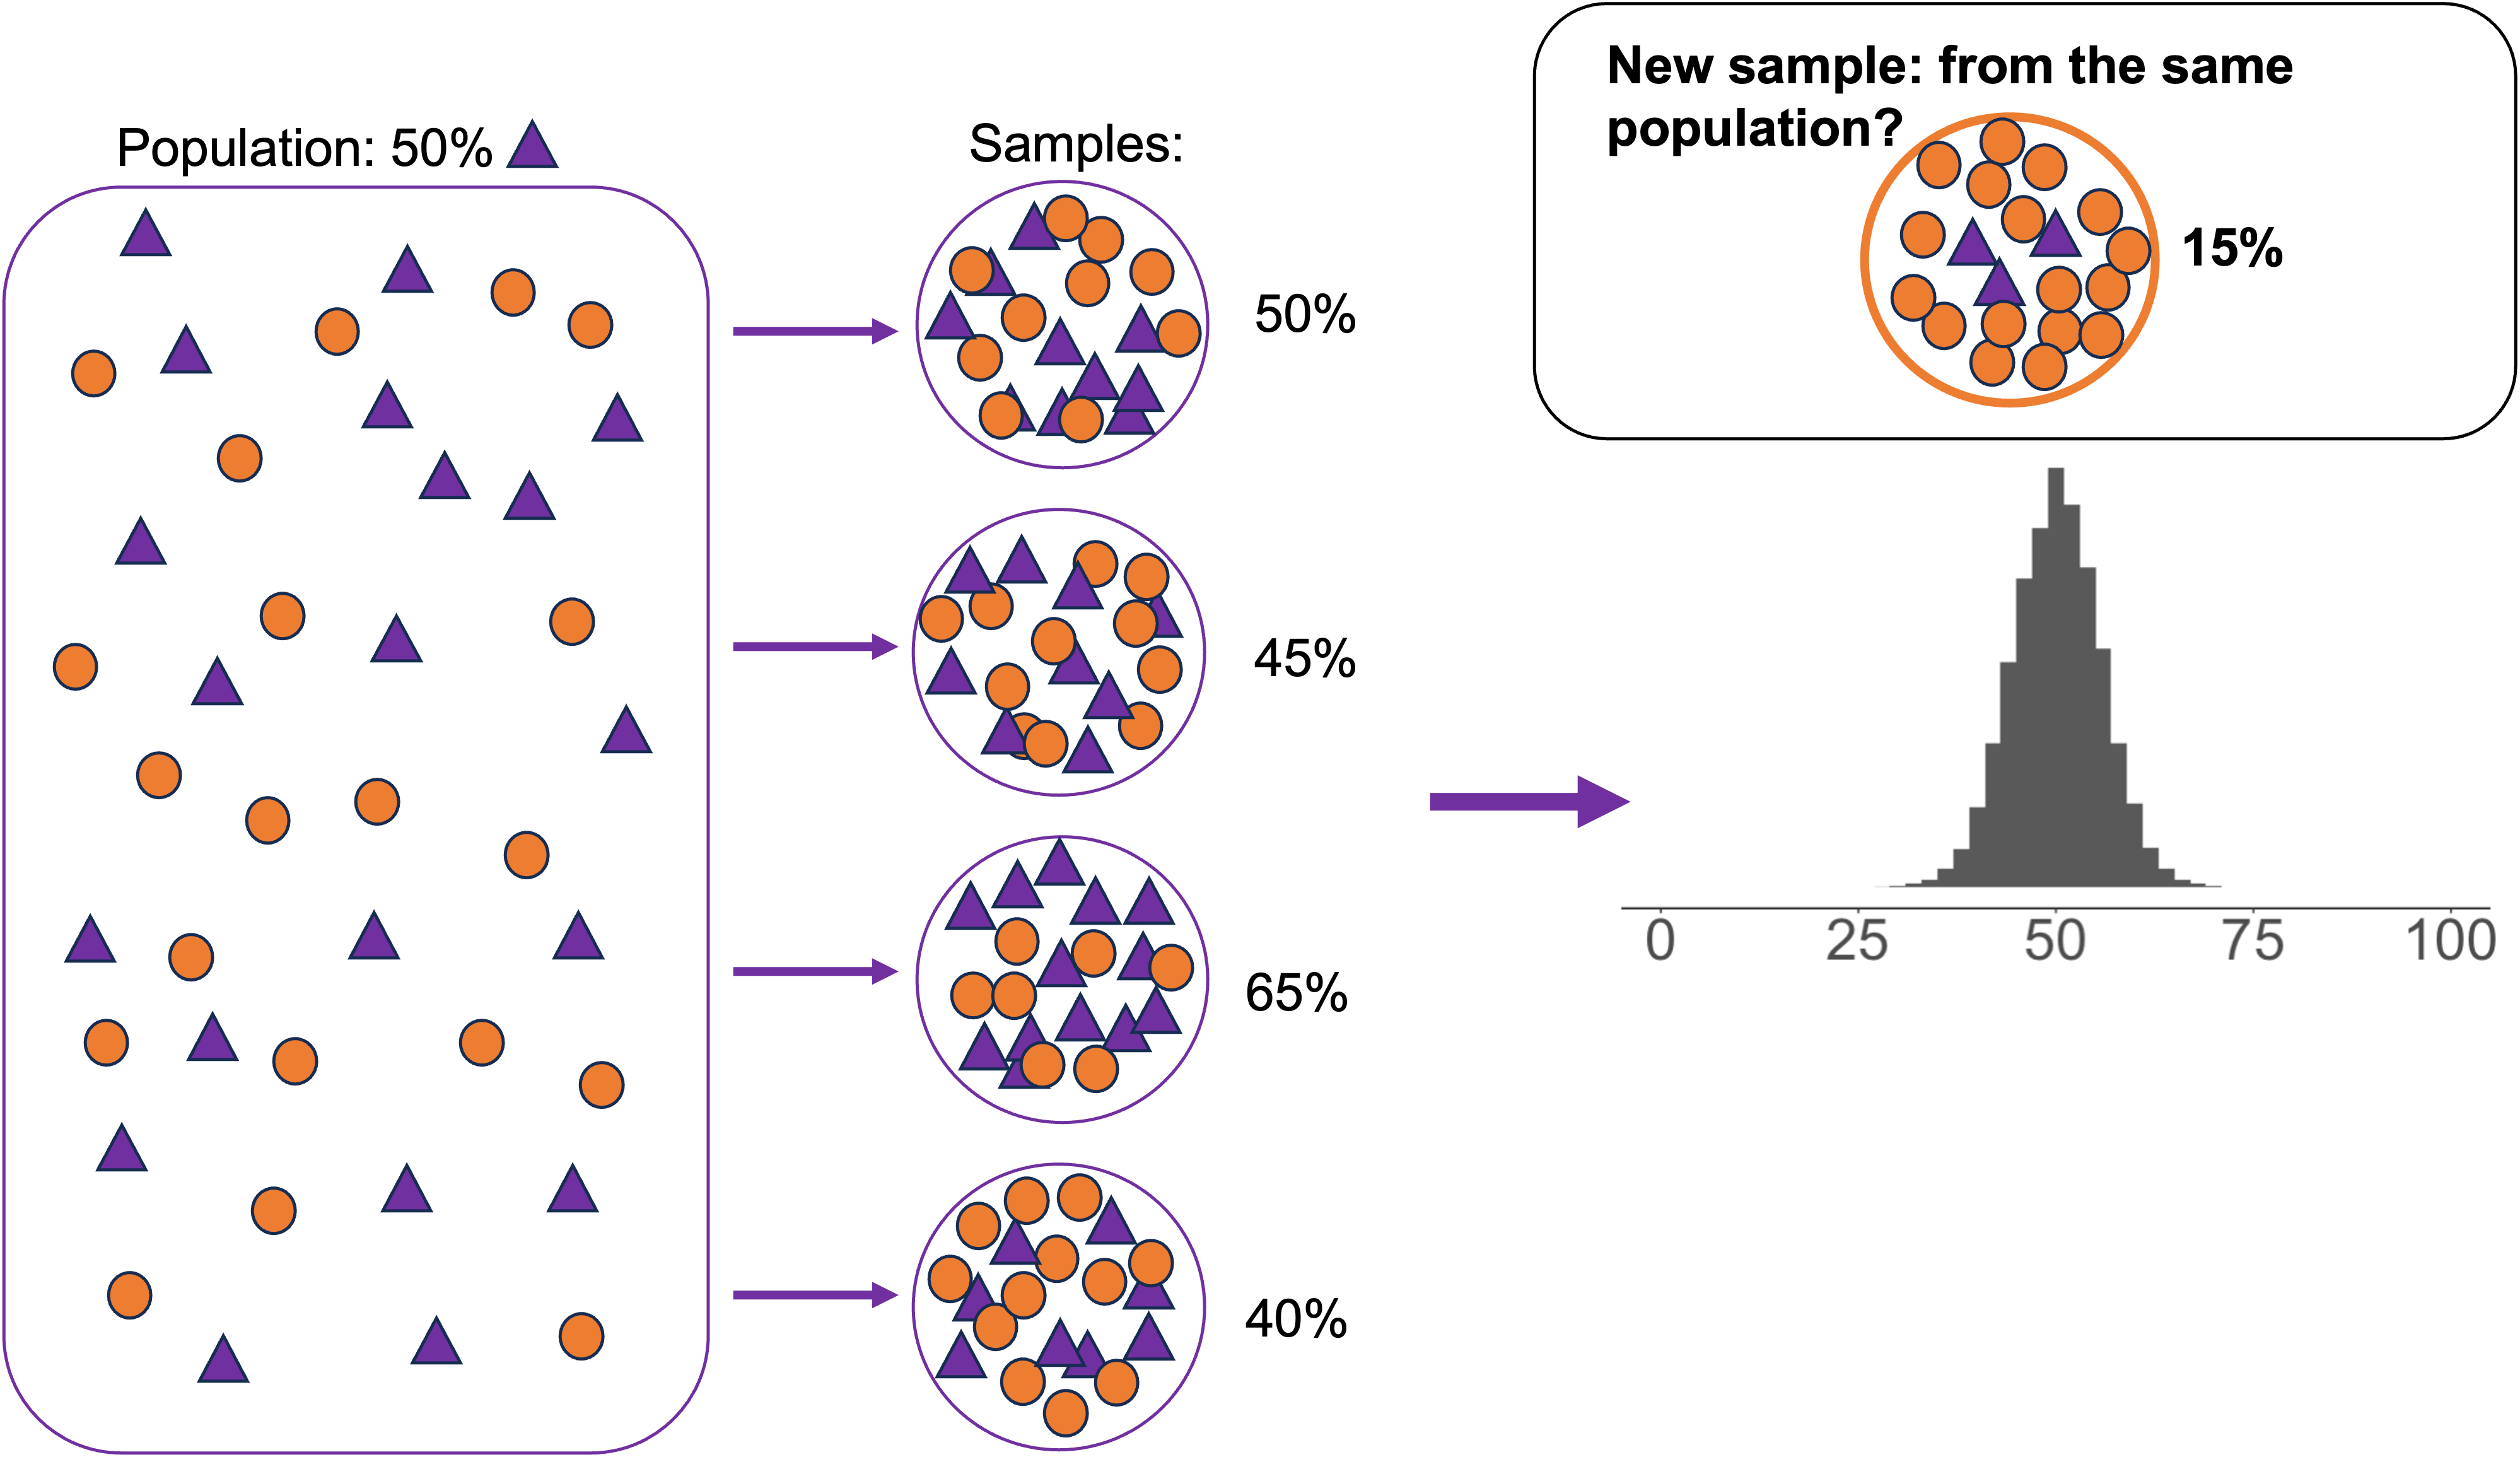
Population parameters and sample statistics
When you randomly draw samples from populations, their sample statistics vary
They vary in a predictable way–following a normal distribution, centered at the population parameter
- This is the Central Limit Theorem
If your sample is outside that expected distribution, it’s probably not from the same population–we can reject the null hypothesis!
Sampling distributions are narrower when sample sizes are bigger, so it’s easier to identify samples from other populations and correctly reject false null hypotheses.
How do we tell if a sample is weird?
- So far we’ve been “eyeballing” whether samples are consistent with null hypotheses or whether they’re weird
- Knowing the shape of the expected sampling distribution is useful because it gives us ways to quantify this
Normal distribution
- Depending on details of your variables, sampling distributions can take different forms
- But many–including proportions and means–are normal
- And the same logic applies across others too
Normal distribution
- We need to know a little more about normal distributions before we can use them for hypothesis testing
- Parameters of a normal distribution are its mean (center) and standard deviation (spread). Normal distributions are always symmetrical and bell-shaped.

Normal distribution

Z scores
Z scores are a statistic that tells you how far away a value is from the center of its distribution in a standardized unit
- The number of standard deviations an observation falls above or below the mean.
- Positive when observation is above the mean, negative when below the mean
They make it possible to compare values on different scales
Z scores example
The SAT and ACT follow nearly normal distributions
- SAT: mean = 1500; standard deviation = 300
- ACT: mean = 21, sd = 5
- Nel scored 1800 on the SAT. Sian scored 24 on the ACT. Who did better?
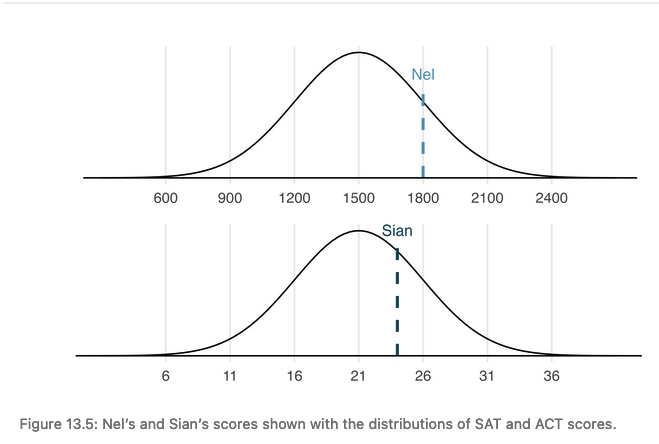
Z scores
- “Weirder” observations have larger Z scores (absolute value): they are further from the mean.
- Formula: Z score = (observation - mean) / sd
- But having the intuition is more important than remembering the formula
Recap
- We know now that we can use the normal distribution to figure out how “weird” an observation is
- If it falls too far outside of what we would expect, we can conclude it came from a different population than we assumed in our null hypothesis
- And therefore we can reject our null hypothesis
Next week
- How do we take data and figure this out?
Plots for your projects
Clarification on three variables:
You want to include three variables in one plot when those variables are all part of one question: ie, how does the relationship between X and Y vary by Z.
Another way you may have written three-variable questions:
- Multiple response variables: How does X affect Y, and also how does X affect Z
- Multiple explanatory variables: How does X affect Y, and also how does Z affect Y
In this case, you’re asking multiple two-variable questions: showing them together in one plot wouldn’t make much sense
For this assignment: One plot is required–pick your favorite sub-question
But making more plots is a snap once you have one–if you want to make plots for all sub-questions, go for it!
Other questions?
